
The problem: three clouds, three dialects
Every major cloud provider will tell you exactly what you spent. The trouble is that each one tells you in its own language. An Azure cost export, a Google Cloud billing export and an AWS cost report all describe the same basic idea (a charge, for a service, in a period, against an account) but they disagree on column names, on how credits and discounts are represented, on what counts as a "service", and on how an account hierarchy is modelled.
If you run workloads across more than one provider, that disagreement lands on whoever has to answer simple questions like "what did we spend on compute last month?" or "which team is driving the increase?". Without a common model, every answer becomes a bespoke reconciliation exercise.
I built a synchronisation architecture to remove that friction: it replicates Azure and GCP billing exports into Amazon S3, normalised under the FinOps Foundation's FOCUS schema, so the data can be visualised alongside AWS in Amazon QuickSight. This post walks through the approach and why a common schema is the part that matters most.
What FOCUS is, and why it helps
FOCUS (the FinOps Open Cost and Usage Specification) is an open specification from the FinOps Foundation that defines a common set of columns and rules for cloud billing data. Instead of learning each provider's export format, you map every source onto the same columns, such as:
BilledCostandEffectiveCost: what was invoiced versus the amortised cost after commitments and discounts.ChargePeriodStart/ChargePeriodEnd: the time window a charge applies to.ServiceNameandServiceCategory: what was consumed, with a provider-neutral category such as Compute or Storage.BillingAccountIdandSubAccountId: where the charge sits in the account hierarchy.RegionId,ResourceIdandTags: the dimensions most allocation and showback work depends on.
Once every provider speaks FOCUS, a single query, a single dashboard and a single set of allocation rules work across all of them. That is the real payoff: you stop maintaining one report per cloud.
The architecture at a glance
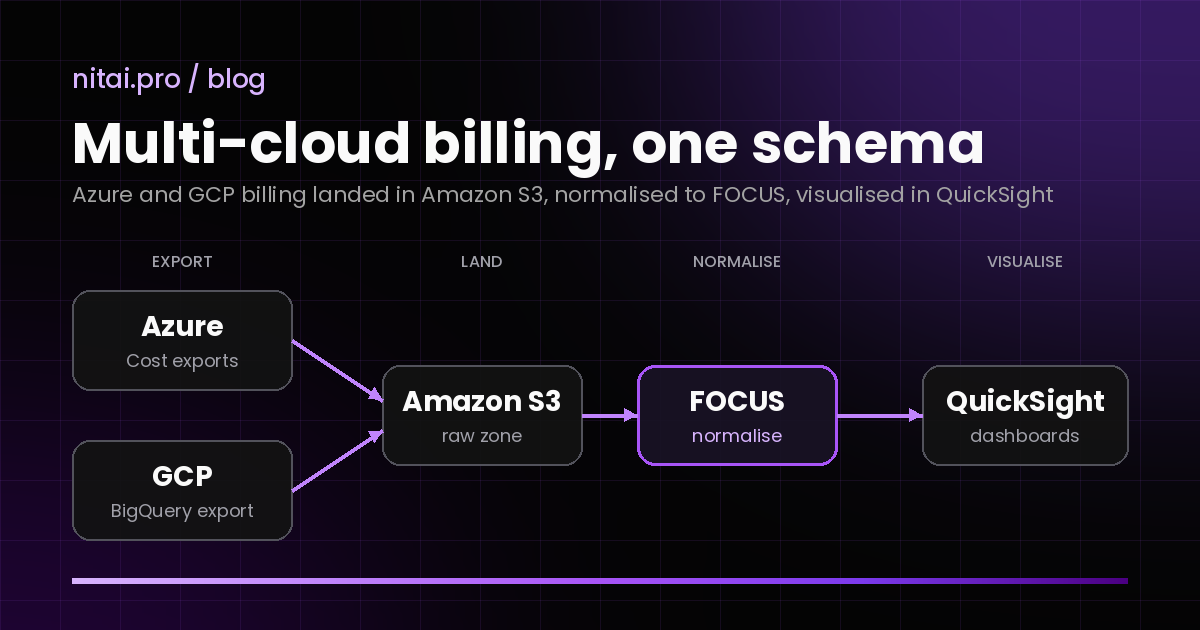
The flow has four stages: export, land, normalise and visualise. Each stage has one job, which keeps the pipeline easy to reason about and easy to re-run when something upstream changes.
Stage 1: export from each provider
Both source clouds can produce scheduled billing exports without any custom scraping:
- Azure Cost Management supports recurring exports of cost and usage details to a storage account, including a FOCUS-formatted dataset option.
- Google Cloud Billing can export detailed usage cost data continuously to BigQuery, where it can be queried or extracted.
The principle at this stage is to rely on the provider's own export mechanism rather than polling billing APIs. Exports are the provider's authoritative record, they are designed for exactly this use, and they make late-arriving adjustments visible instead of silently missing them.
Stage 2: land the raw data in S3
The next step is replicating those exports across clouds into Amazon S3. A pattern that works well here is to keep two zones:
- A raw zone that holds the export files as received, partitioned by provider and billing period. Nothing is transformed here, so you always have an audit trail back to the source.
- A normalised zone that holds the FOCUS-shaped output the dashboards read from.
Keeping raw data untouched is what makes re-processing safe. Billing data is revised after the fact (credits land late, invoices are finalised days after month end), so the pipeline should be able to rebuild any billing period from its raw files.
Stage 3: normalise to FOCUS
This is the heart of the pipeline. For each provider, source columns are mapped onto FOCUS columns, and provider-specific concepts are translated into FOCUS semantics. A simplified, illustrative view of what that mapping looks like:
| Concept | Azure cost details | GCP billing export | FOCUS column |
|---|---|---|---|
| Amount invoiced | CostInBillingCurrency | cost + SUM(credits.amount) | BilledCost |
| When it happened | Date | usage_start_time | ChargePeriodStart |
| What was used | ConsumedService | service.description | ServiceName |
| Broad category | MeterCategory (mapped) | service.description (mapped) | ServiceCategory |
| Where it is billed | SubscriptionId | project.id | SubAccountId |
| Location | ResourceLocation | location.region | RegionId |
Two details in that table are easy to get wrong. In the GCP export, credits is a repeated field whose amounts are negative, so the net cost of a row is cost plus the sum of its credit amounts rather than cost alone. And provider fields such as Azure's MeterCategory rarely line up one-to-one with FOCUS's fixed list of service categories, so they need an explicit mapping table instead of a straight copy. Treat the column names above as a starting point and check them against the export version you actually receive.
Where a provider already offers a FOCUS-aligned export or view, the job gets easier, but it does not disappear. You still need to check the spec version each source conforms to, handle columns that are optional or empty for one provider, and make sure currencies and time zones line up before anything is compared.
A few checks are worth running on every load:
- Totals reconcile: the sum of
BilledCostper billing period should match the provider's own invoice total for that period. - Required columns are populated: rows with missing periods or accounts are flagged rather than silently dropped.
- No double counting: re-running a period replaces its data instead of appending to it.
Stage 4: query and visualise in QuickSight
With all three clouds in one FOCUS-shaped dataset in S3, Amazon QuickSight becomes the single place to explore spend. Typically you put a query layer between S3 and QuickSight (for example, a catalogued table queried through Amazon Athena) so dashboards read a consistent, typed schema.
Because every row uses the same columns, the dashboards themselves stay provider-agnostic. Filtering by provider is just another slicer (ProviderName in earlier versions of the spec; more recent versions split this into ServiceProviderName and HostProviderName), and views such as spend by ServiceCategory, cost trends by SubAccountId or tag-based showback work the same way regardless of where the workload runs.
What I would tell someone starting out
- Agree on the schema first. FOCUS gives you a well-documented target that other people already understand, which beats inventing an internal one.
- Treat billing data as mutable. Design every stage to re-process a whole billing period idempotently.
- Reconcile against invoices early. A dashboard nobody trusts is worse than no dashboard.
- Keep raw and normalised data separate. It is cheap insurance when a mapping turns out to be wrong.
Multi-cloud cost visibility is less about clever tooling and more about agreeing on a common language. FOCUS provides that language; the pipeline's job is simply to translate into it, reliably, every time new billing data lands.